Ranking of global power generation in 2019 and global per capita power consumption in 2020
Writer: Hengfeng you electric Time:2021-07-18 views:times
In 2019, the power generation of all countries and regions in the world will exceed 27 trillion kWh (27004.7twh) for the first time, with a year-on-year growth of 1.3%. In 2020, global coal-fired power generation will drop by 4% year-on-year in 2020, the largest decline in history.

In 2019, China's power generation continues to rank first in the world. According to BP's report, "7503.4twh, a year-on-year increase of 4.7%, accounting for 27.8% of the global total power generation (since 2011, China's power generation has been ranked first in the world).
In 2019, the power generation of the United States is about 4401.3twh (more than 4.4 trillion kwh), a year-on-year decrease of 1.3%, and its proportion in the global total power generation will drop to 16.3%, ranking second in the world. Third is India. The power generation in 2019 will be about 1558.7twh (close to 1.6 trillion kwh), an increase of 0.5%, accounting for about 5.8% of the global total. The fourth place is Russia, with power generation of 1118.1twh in 2019, a year-on-year growth of 0.8%, accounting for about 4.1% of the world's total; The fifth place is Japan, with a power generation of 1036.3twh in 2019, a year-on-year decrease of 1.9% and a global share of 3.8%. The sixth place is Canada, with a power generation capacity of 660.4twh in 2019, a year-on-year growth of 1.2% and a global share of 2.4%; In 2019, Brazil's power generation will catch up with that of Germany, with 625.6twh and 612.4twh respectively, accounting for about 2.3% of the world's total. Then came South Korea (584.7twh, 9th), France (555.4twh, 10th), Saudi Arabia (357.4twh, 11th), Britain (323.7twh, 12th) and Iran (318.7twh, 13th). From the perspective of energy consumption structure, Japan is dominated by oil and coal, France is dominated by nuclear energy and oil, and Brazil is dominated by oil and hydropower.
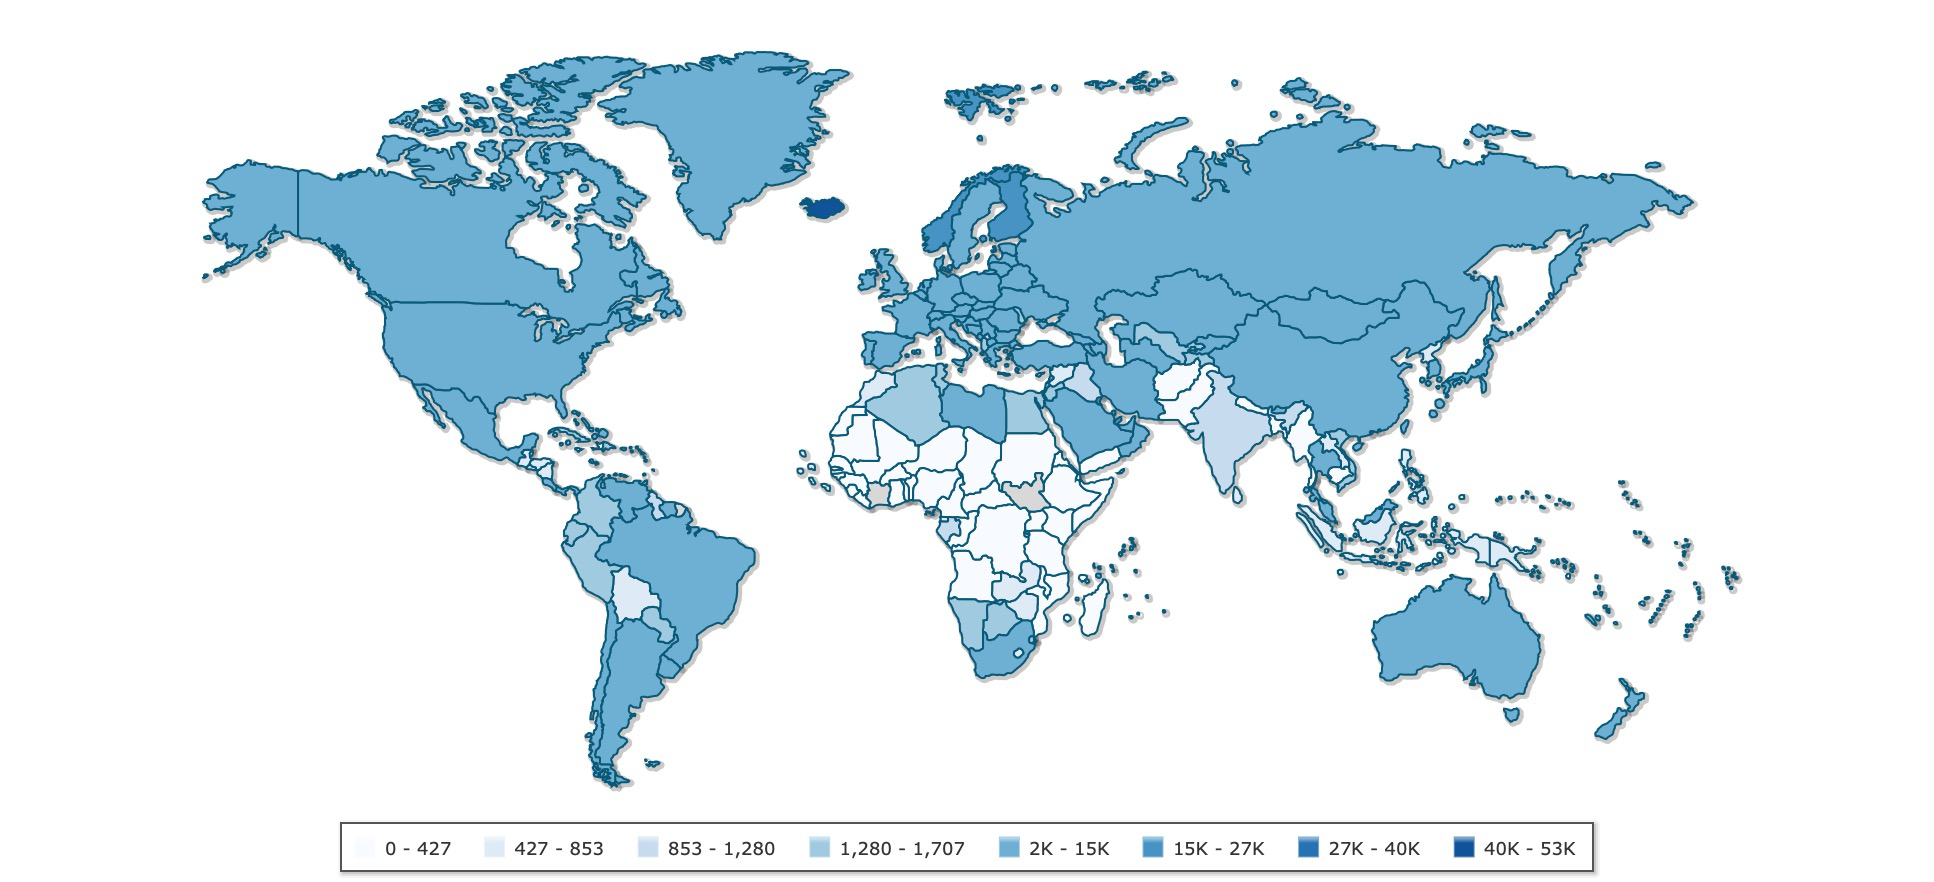
The following is the ranking of power consumption per capita in the world:
The map shown here shows how this indicator varies by country. The shadow of the country corresponds to the size of the indicator. The deeper the shadow, the higher the value.


